My first response to
Statista was “oooh, pictures!” but when I started doing some searching, I was really impressed by the breadth of the statistics available, not just the presentation of them. For quick statistics to make your papers and presentations pop, it’s a great resource.

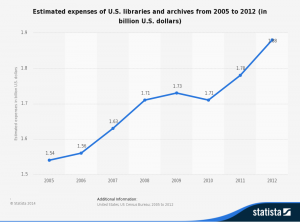
You can find lots of different topics in Statista: apples and iPhones, club venues and libraries. Searching it is simple, and once you’ve found what you need,
Statista is totally okay with your downloading the chart and putting it in your presentations and papers – they even have tools to make it easy.
But what if you need just a little more information?
Take a look at the source and release information that tell where the statistics come from.
Statista also publishes infographics that are fun to browse, timely, and easy to tweet or embed in blog posts (with proper attribution, of course).
Next time you need a few statistics, give
Statista a try!

 You can find lots of different topics in Statista: apples and iPhones, club venues and libraries. Searching it is simple, and once you’ve found what you need, Statista is totally okay with your downloading the chart and putting it in your presentations and papers – they even have tools to make it easy.
But what if you need just a little more information? Take a look at the source and release information that tell where the statistics come from.
Statista also publishes infographics that are fun to browse, timely, and easy to tweet or embed in blog posts (with proper attribution, of course).
Next time you need a few statistics, give Statista a try!
