Queer (In)Time: Student Curated Exhibit Using Archives and Special Collections Opens
On October 1, in celebration of “OUTTober” on Northeastern’s campus, an exhibit made in collaboration with the LGBTQA Resource Center and the Archives and Special Collections will open in the Center for Intercultural Engagement at 5:00pm.
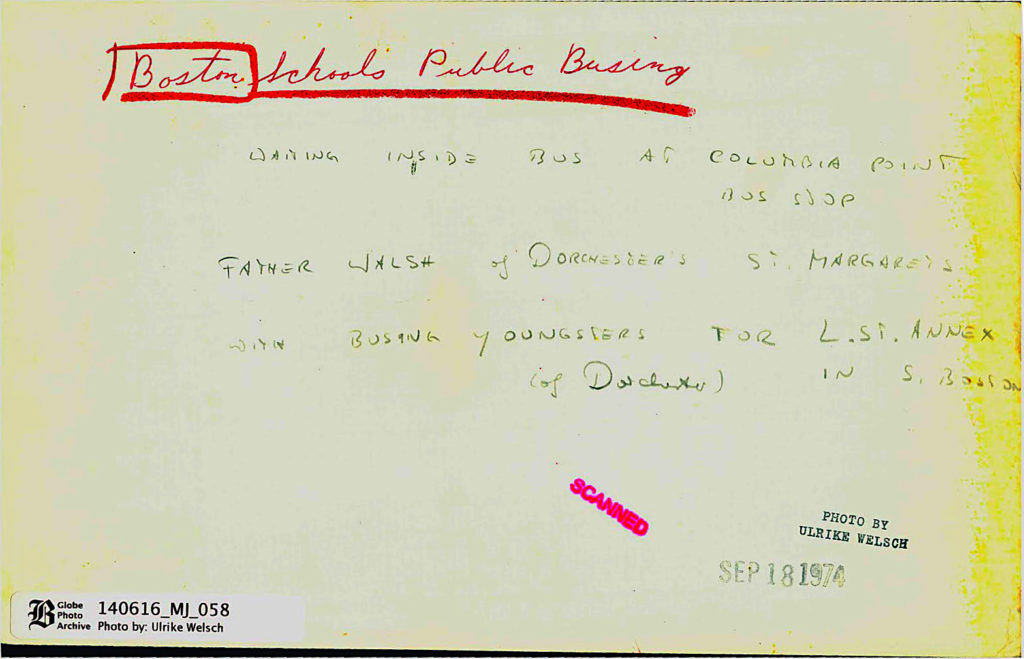
The exhibit, titled “Queer (In)Time,” explores the array of Boston LGBTQA history housed in the Northeastern University Archives and Special Collections. Student curators, Jess Bardio and Nate Brown, who also work at the LGBTQA Resource Center, selected material for display focusing on four themes: Northeastern University LGBTQA Organizations, AIDS Activism in Boston, Existing LGBTQA organizations in Boston, and Intersectionality in Boston LGBTQA history.
Jess Bardio, who curated the AIDS Activism and Northeastern University LGBTQA Organizations portions of the exhibit, reflected on her curation:
“As an engineering student, I don’t often get to work on projects relating to history or culture. Getting the opportunity to go through Snell Library’s archives and experience Boston’s queer history for myself was really inspiring, and getting to curate an exhibit that I get to share with my community feels really powerful.
This work came at an especially important time in my life—this weekend I attended the Out for Undergrad Engineering conference. Having the time and space to reflect on the progress made by the queer community really helped me put this weekend in perspective and make the most of my time with fellow ‘engiqueers’!”
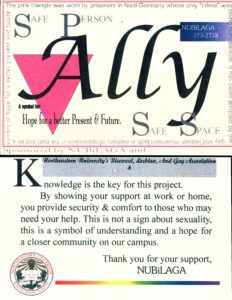
Nate Brown, who curated the Existing LGBTQA Organizations and Intersectionality in Boston LGBTQA portions of the exhibit reflected on their work:
“I felt responsible to use this source material carefully, to present the past without erasing anyone’s contributions to it, in order to tell a story that could resonate with all queer people and not just the most visible. I spent a lot of time wondering about the people who wrote the articles or were pictured in the photos, and where they had gone since then, or if they were even still around today.
It struck me that the queer community in Boston and across the country used to be much tighter knit and more communal, and over the years (through the AIDS crisis, gentrification, lopsided social acceptance) we’ve grown apart. It’s my hope that examining the past can help us grow back together in the future, and promote a sense of unity and responsibility to lift each other up.”
Come to the Center for Intercultural Engagement on October 1 at 5pm to celebrate the opening of the exhibit. Find more about the event on the LGBTQA Resource Center site. The exhibit was generously funded through a grant from the Northeastern Office of Institutional Diversity and Inclusion.
Learn more about our LGBTQA Special Collections by visiting lgbtqahistory.library.northeastern.edu.