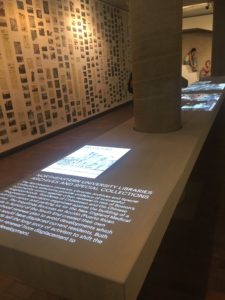
The Archives and Special Collections finding aids have a new look!
The Northeastern University Library Archives and Special Collections has over 300 processed collections, so it can be an understandably overwhelming place to know where and how to search through all of these materials. Luckily, each collection comes with a finding aid that provides historical and biographical information on the collection and an inventory of materials in the collection. These finding aids have recently moved to a new platform that allows for a more efficient and user-friendly way for both old and new patrons of the archives to find what they are looking for.
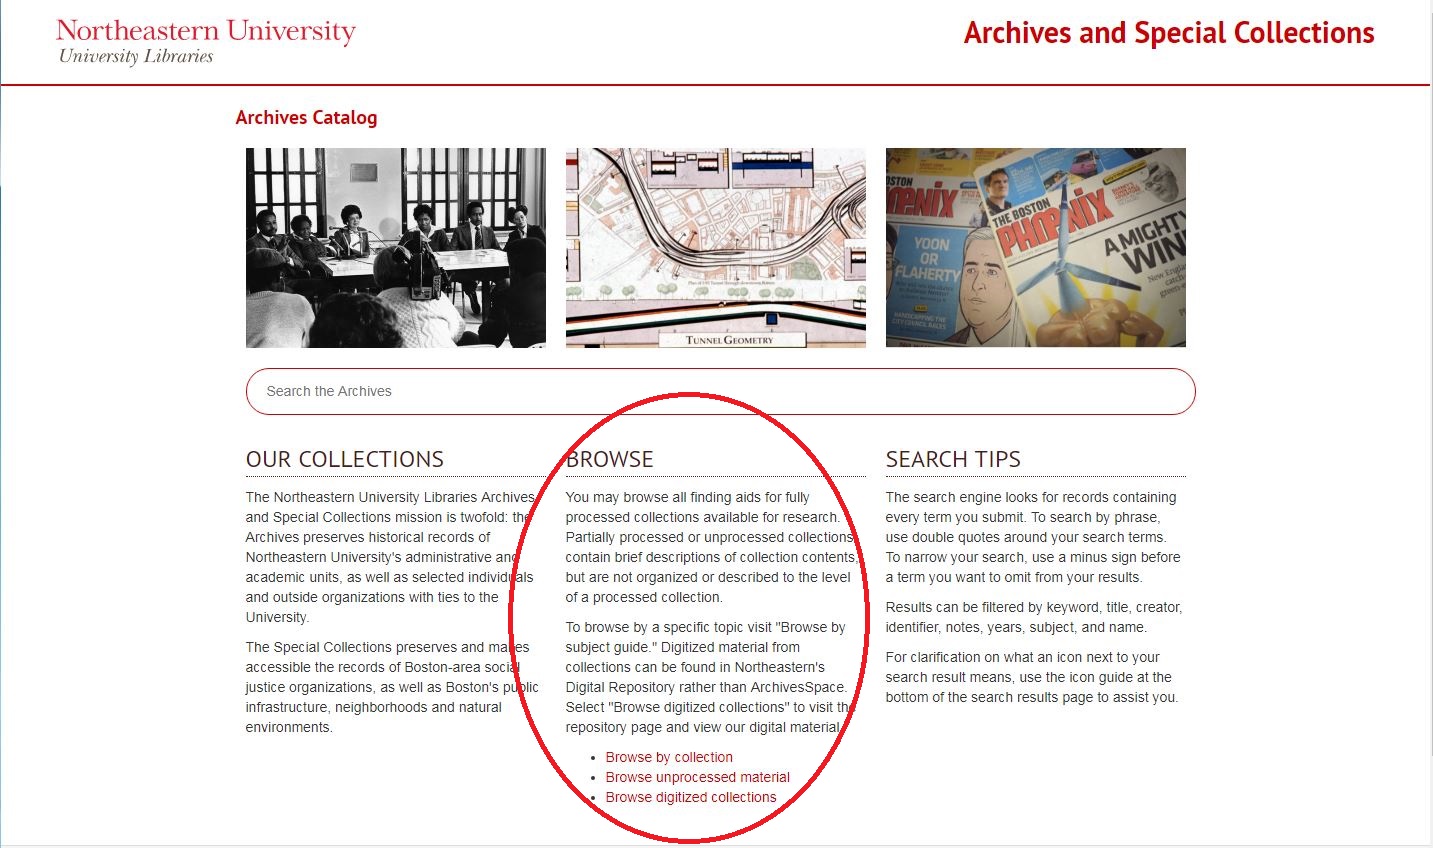
To begin your search, visit the Archives Catalog homepage at https://archivesspace.library.northeastern.edu/. If you know what you are looking for, you can put it in the search bar and begin your search. If you are unsure of where to start, there are links that allow you to browse the collections.*Search tip* When searching by a person’s name or by a phrase, use quotation marks around the terms in order to find that specific phrase.
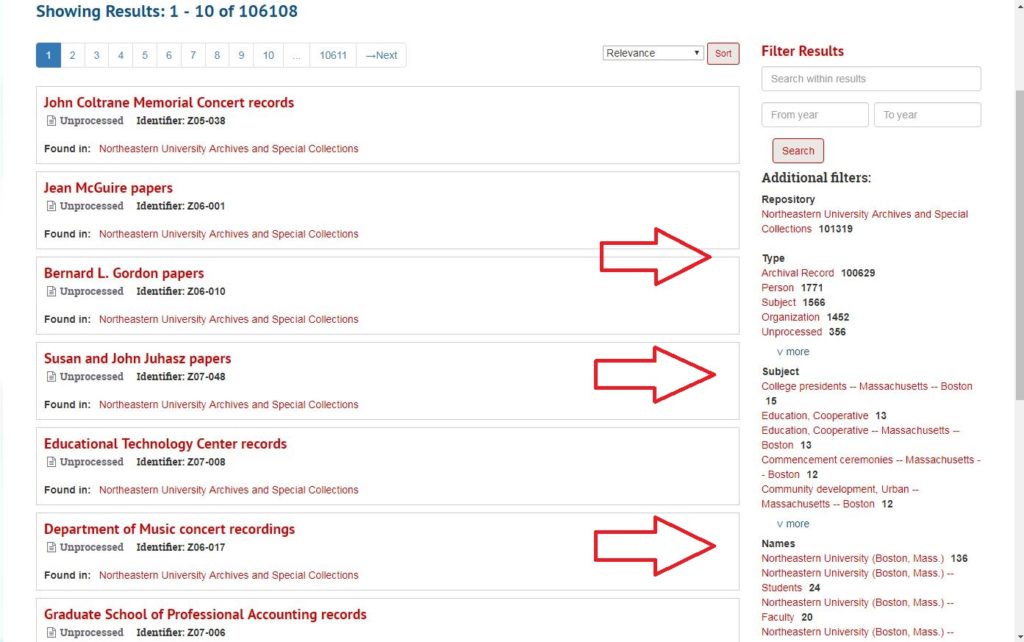
 You will then be redirected to the page with the results of your search. From this page, you can add filters such as type, subject, names, and year in order to find exactly what you are looking for.
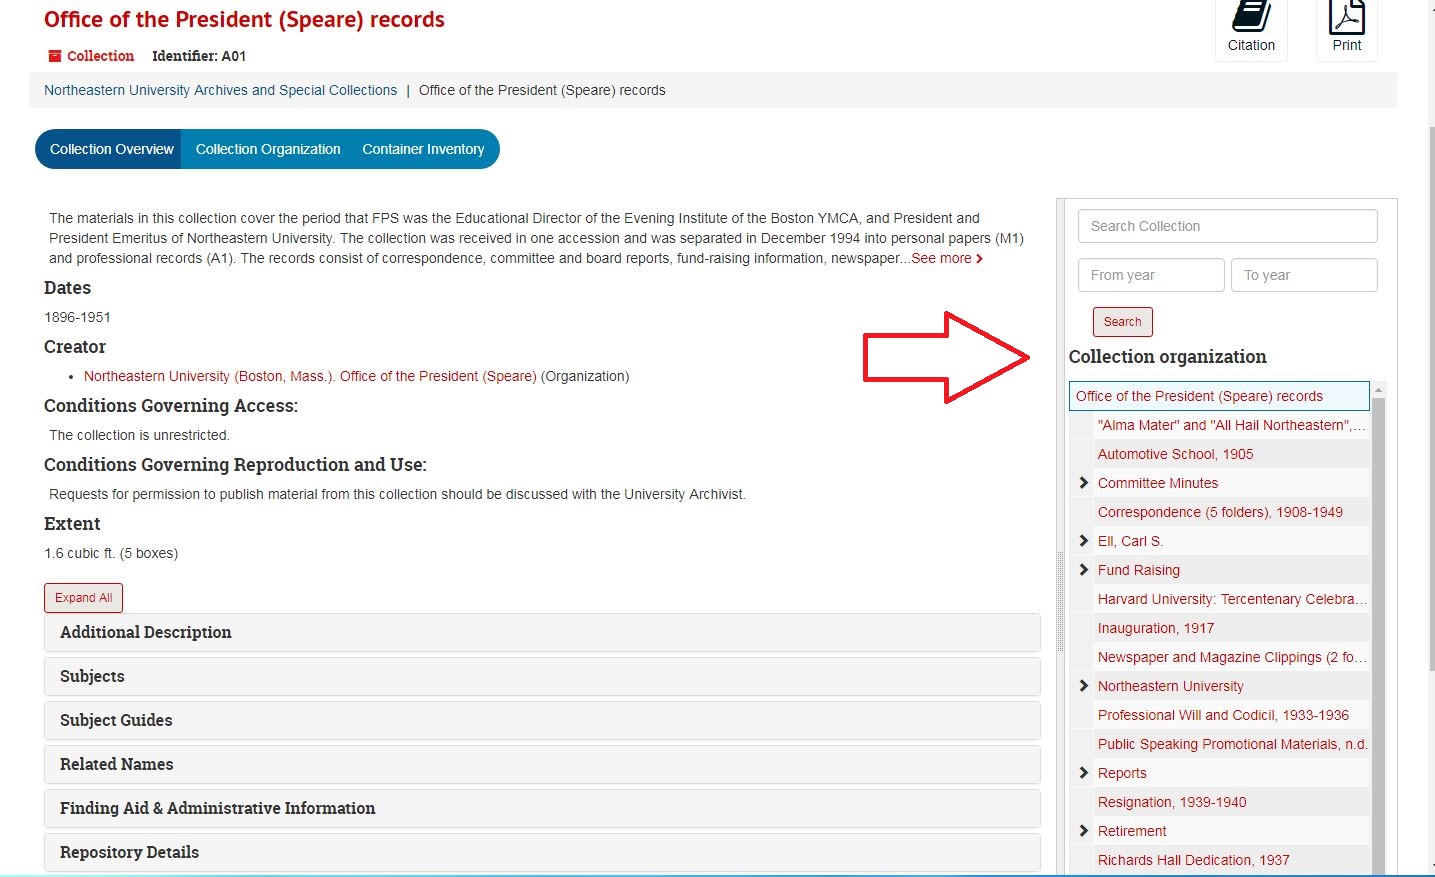
 When you find a collection that you are interested in, you can click on the collection name to look further into the collection. Each collection has a description on either the person or organization, as well as the types of materials within the collection. On the right side is a menu with the series and sub-series and a full folder inventory of materials.
 If you need to do another search, you can click on the magnifying glass at the top of the page, or on the Archives and Special Collections link in the top right corner and you will be able to start your search process over.
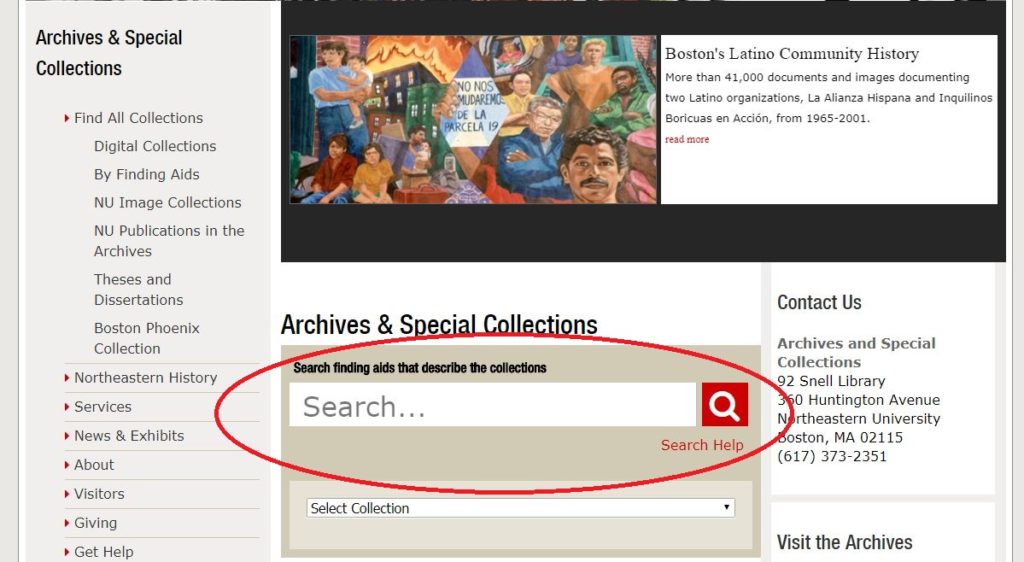
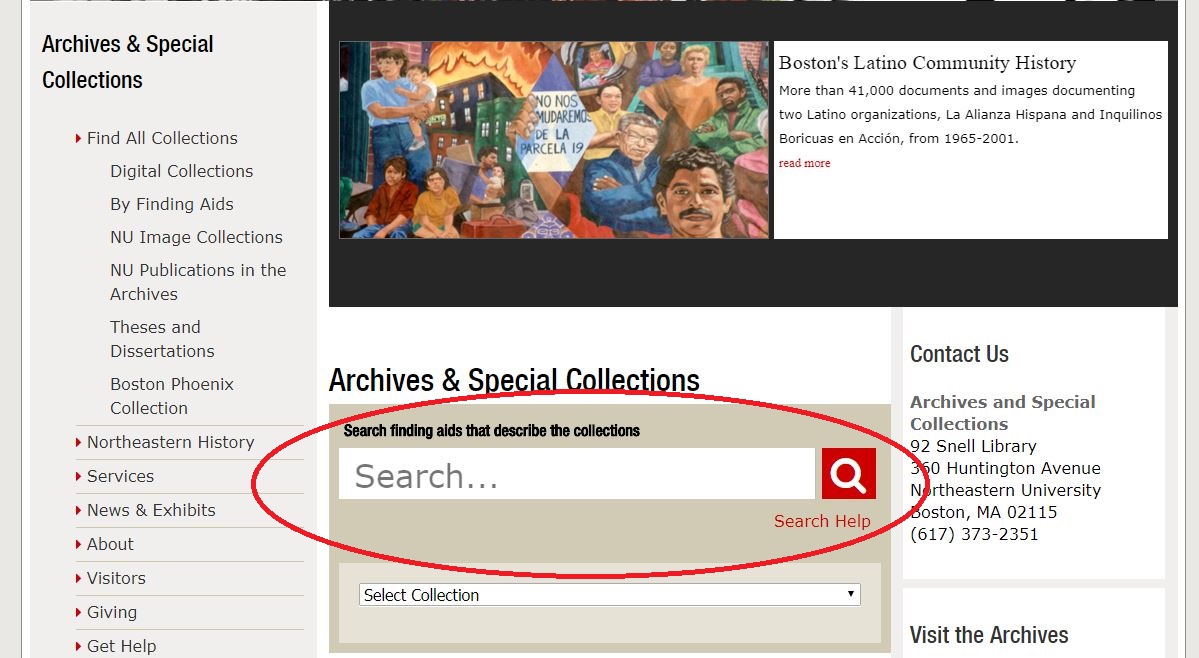
If you are already on the Archives and Special Collections homepage, you can use the search bar in the middle of the page. Simply type in your search term and you will be redirected to the Archives Catalog page.
If you need to do another search, you can click on the magnifying glass at the top of the page, or on the Archives and Special Collections link in the top right corner and you will be able to start your search process over.
If you are already on the Archives and Special Collections homepage, you can use the search bar in the middle of the page. Simply type in your search term and you will be redirected to the Archives Catalog page.
 So take a look and see what we have to offer and we look forward to seeing you down in the archives! If you have any questions, email us at archives@northeastern.edu and we will be happy to help in any way we can!
 You will then be redirected to the page with the results of your search. From this page, you can add filters such as type, subject, names, and year in order to find exactly what you are looking for.
 When you find a collection that you are interested in, you can click on the collection name to look further into the collection. Each collection has a description on either the person or organization, as well as the types of materials within the collection. On the right side is a menu with the series and sub-series and a full folder inventory of materials.
 If you need to do another search, you can click on the magnifying glass at the top of the page, or on the Archives and Special Collections link in the top right corner and you will be able to start your search process over.
If you are already on the Archives and Special Collections homepage, you can use the search bar in the middle of the page. Simply type in your search term and you will be redirected to the Archives Catalog page.
If you need to do another search, you can click on the magnifying glass at the top of the page, or on the Archives and Special Collections link in the top right corner and you will be able to start your search process over.
If you are already on the Archives and Special Collections homepage, you can use the search bar in the middle of the page. Simply type in your search term and you will be redirected to the Archives Catalog page.
 So take a look and see what we have to offer and we look forward to seeing you down in the archives! If you have any questions, email us at archives@northeastern.edu and we will be happy to help in any way we can!
 In May, Snell Library welcomed our first-ever First Year Experience and Undergraduate Engagement Librarian, Evie Cordell. Evie works with the First Year Writing Program, General Studies Program, Explore Northeastern, and many other programs that support first year students at Northeastern. Over the course of the summer and these first weeks of fall, Evie has organized library tours, welcome sessions, and scavenger hunts. If you’re a new student in the College of Engineering, you’ve probably met Evie as part of your library research workshop.
Evie is a graduate of the University of Virginia (BA, Religious Studies), and the University of Illinois at Urbana-Champaign (MA in Library and Information Science). She’s mom to five kids, author of the children’s book Two Girls Want a Puppy, and speaks German pretty fluently. Say hello to Evie at the Research Help desk in the lobby of Snell Library–if you haven’t already met her at a library orientation!
You can follow Evie on Twitter at eviedc or email her at
In May, Snell Library welcomed our first-ever First Year Experience and Undergraduate Engagement Librarian, Evie Cordell. Evie works with the First Year Writing Program, General Studies Program, Explore Northeastern, and many other programs that support first year students at Northeastern. Over the course of the summer and these first weeks of fall, Evie has organized library tours, welcome sessions, and scavenger hunts. If you’re a new student in the College of Engineering, you’ve probably met Evie as part of your library research workshop.
Evie is a graduate of the University of Virginia (BA, Religious Studies), and the University of Illinois at Urbana-Champaign (MA in Library and Information Science). She’s mom to five kids, author of the children’s book Two Girls Want a Puppy, and speaks German pretty fluently. Say hello to Evie at the Research Help desk in the lobby of Snell Library–if you haven’t already met her at a library orientation!
You can follow Evie on Twitter at eviedc or email her at