Celebrate Pride Month!
In case you haven’t heard, June is LGBT Pride Month! Celebrate by reading one of these LGBT books:
Rubyfruit Jungle by Rita Mae Brown
Rubyfruit Jungle, first published in 1973 and still painfully relevant today, follows protagonist Molly Bolt, comfortable as lesbian though everyone around her isn’t. While the slang the characters use won’t let you forget this book is from the ‘70s, Molly’s life as a queer individual is not so different than some people’s today, and it’s refreshing to follow a character whose sexual identity does not result in ultimate unhappiness, but drives her to succeed.
 Aristotle and Dante Discover the Secrets of the Universe by Benjamin Alire Sáenz
No, this book is not about a philosopher and a poet traversing through space and time (but wouldn’t that be great?!). In Sáenz’s novel, two Mexican-American boys grapple with car crashes, romance, and hate crime in the 1980s. As they grow older, they seek the definition of love and acceptance for who they are.
 The Night Watch by Sarah Waters
Starting in 1947 and working its way back to 1941, The Night Watch follows the lives of four twenty-something year olds trying to piece their lives together in WWII London. Each character’s story is told separately, often with guest appearances from some of the others. The narrative moves backwards in time, so as you go you’ll learn more about events that were only hinted at previously and discover what made these people who they are.
 Liquor by Poppy Z. Brite
First in its series by trans writer Poppy Z. Brite, Liquor stars Rickey and G-Man, best friends, boyfriends, and line cooks in New Orleans. When Rickey is unexpectedly fired, the two decide to open a restaurant where every dish is cooked with some sort of liquor. The protagonists of this novel are gay, but the plot has nothing to do with their sexuality, offering a welcome change from the typical coming-out story.
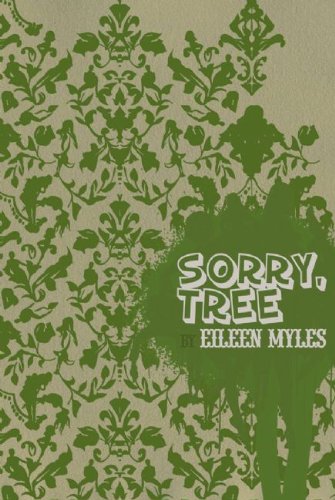
This collection by punk poet Eileen Myles combines love with politics to take a definitive stance on what it means to be a lesbian. With her signature style of haphazard rhythm and unmetered stanzas, Myles’ work feels raw and powerful. It’s only 83 pages—bring it for your T ride to Boston Pride Festival this Saturday!


