Snell Library is proud to welcome four new co-ops this semester:
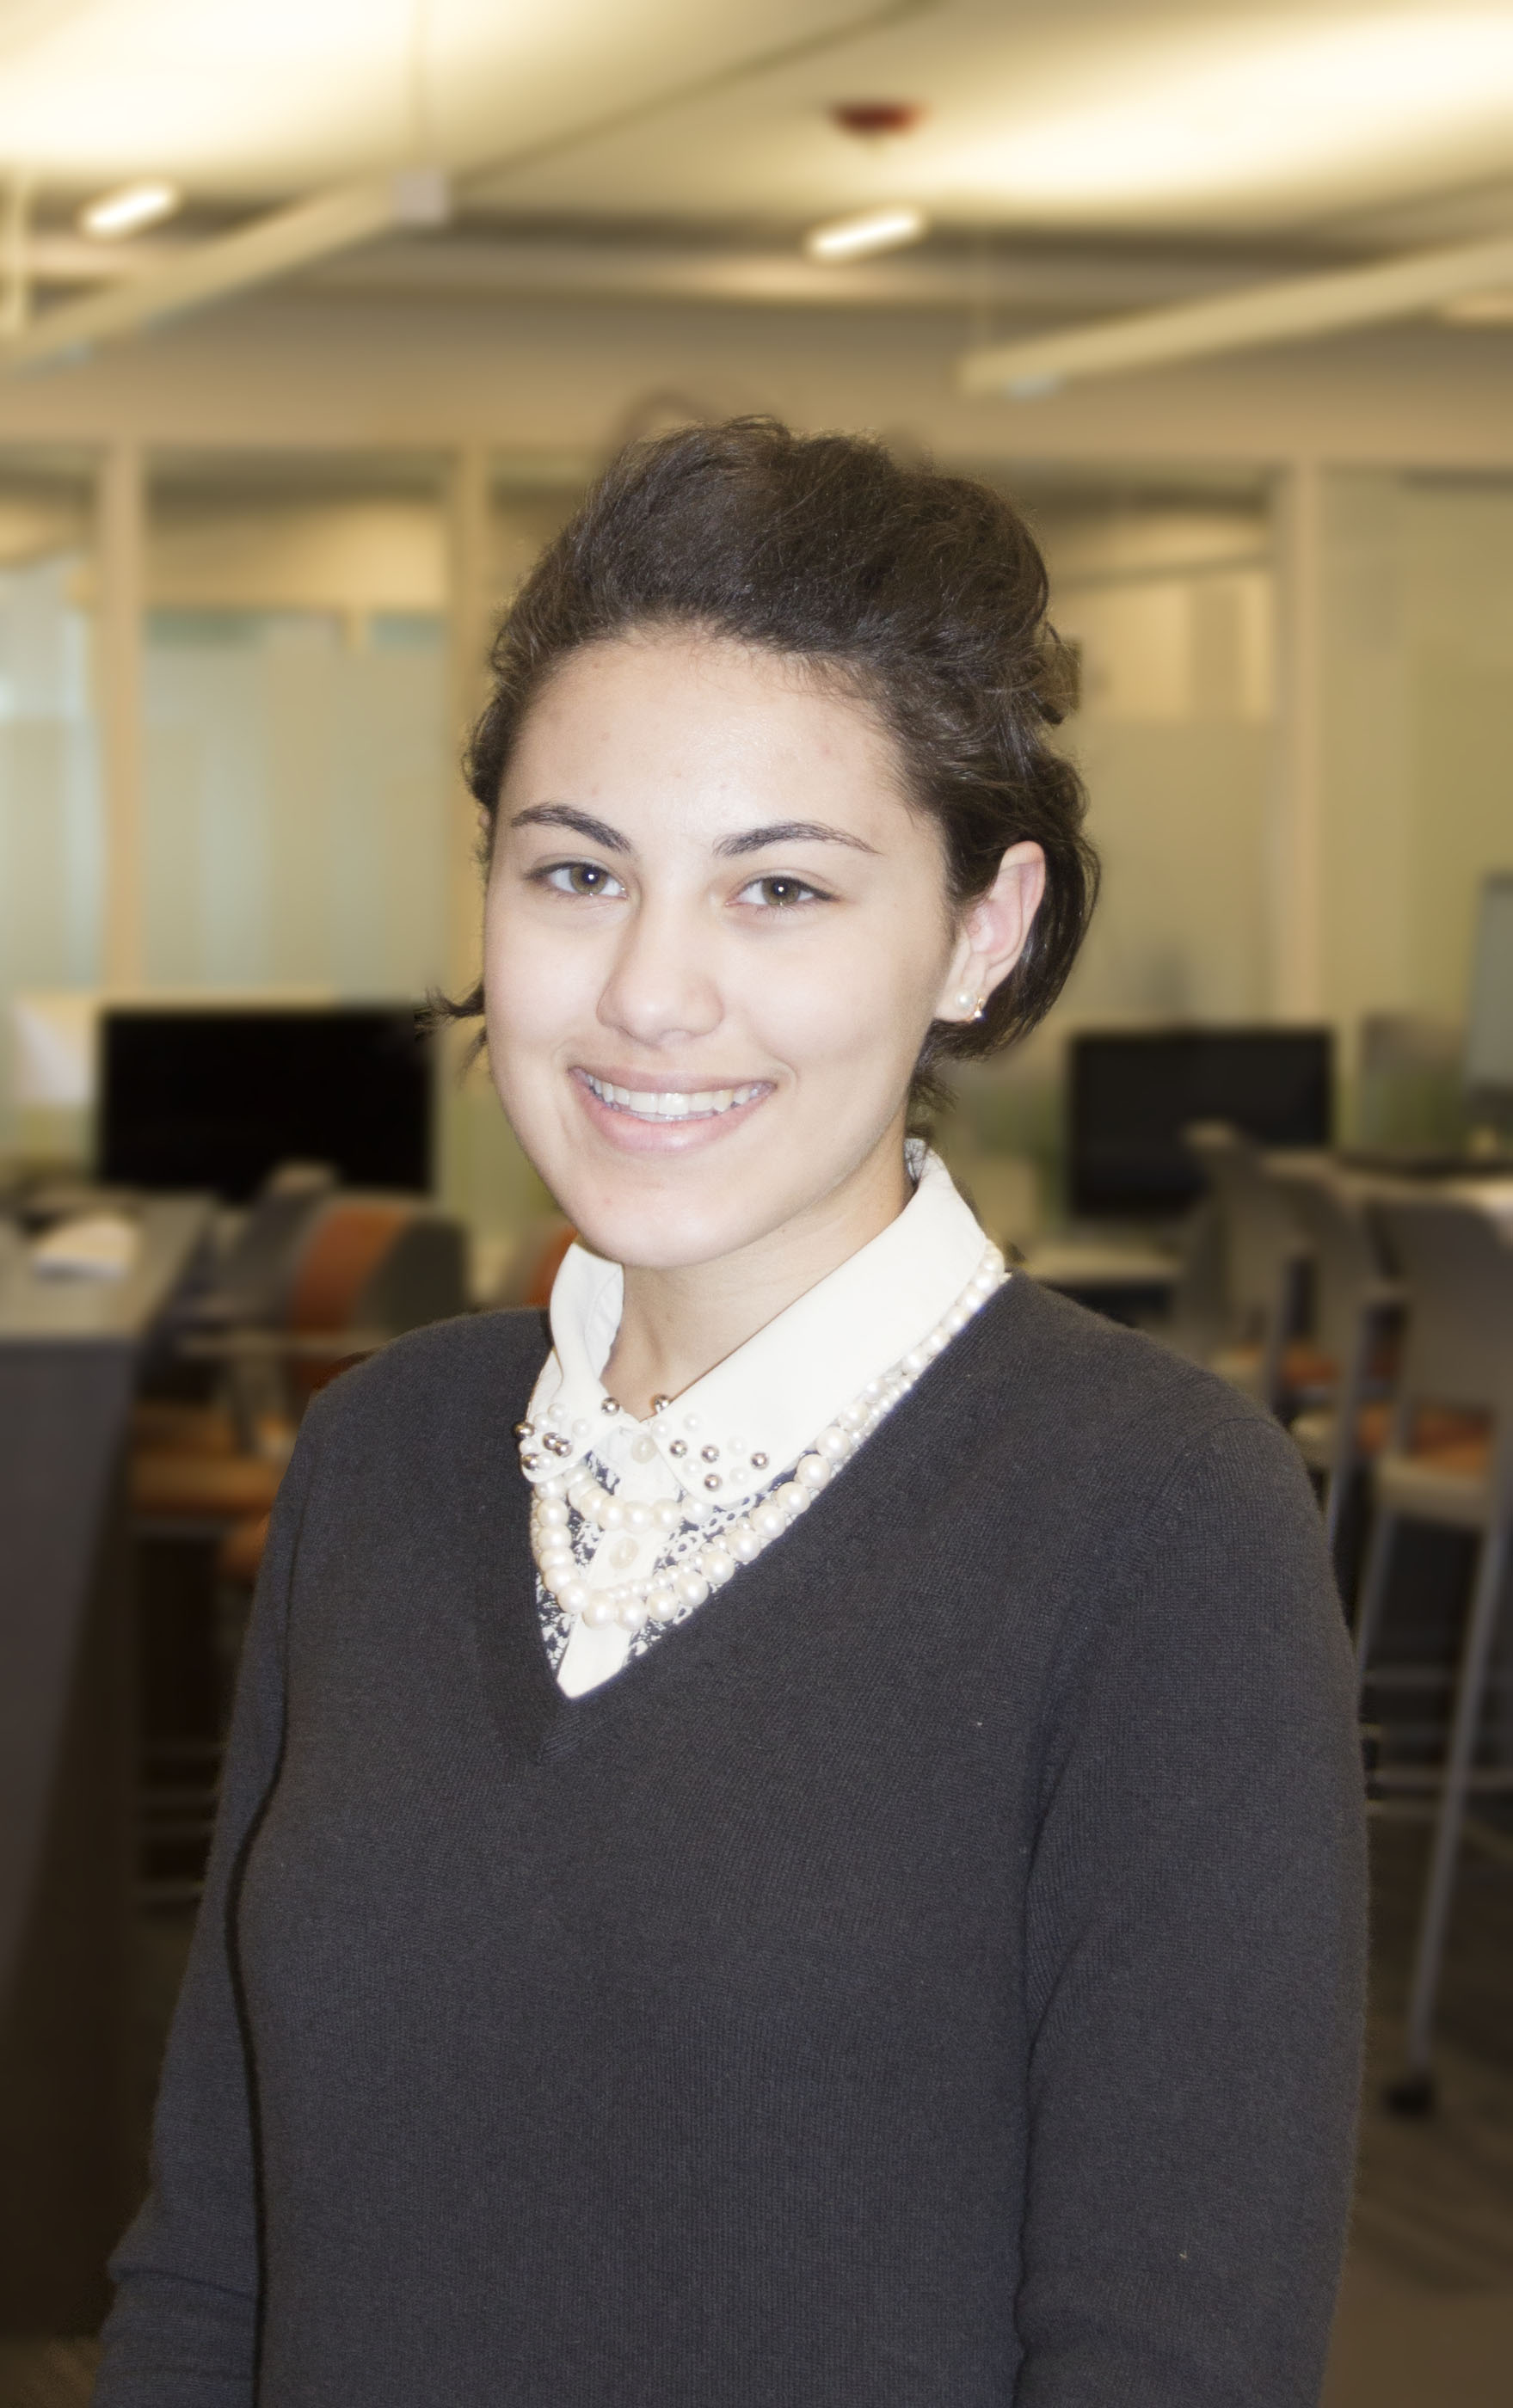
Marketing and Events Co-op: Emily Nehme
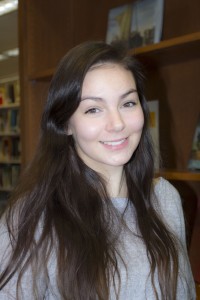
My name is Emily Nehme and I am the Marketing and Events Co-op in Snell Library’s Communications Office. I will help to promote and organize events hosted by the library. I am currently a second year Business Administration major with a concentration in Marketing. I really enjoy traveling and have had the chance to visit and live in some amazing countries. I look forward to being a part of the library community!
Graphic Design Co-op: Amanda Winfield

My name is Amanda and I am a 3
rd year Animation major with a double minor in Art and Interactive Media. My artistic interests are broad and I am always excited to acquire new knowledge regarding art & design. My hobbies include: painting, sewing, drawing, and occasional video gaming.
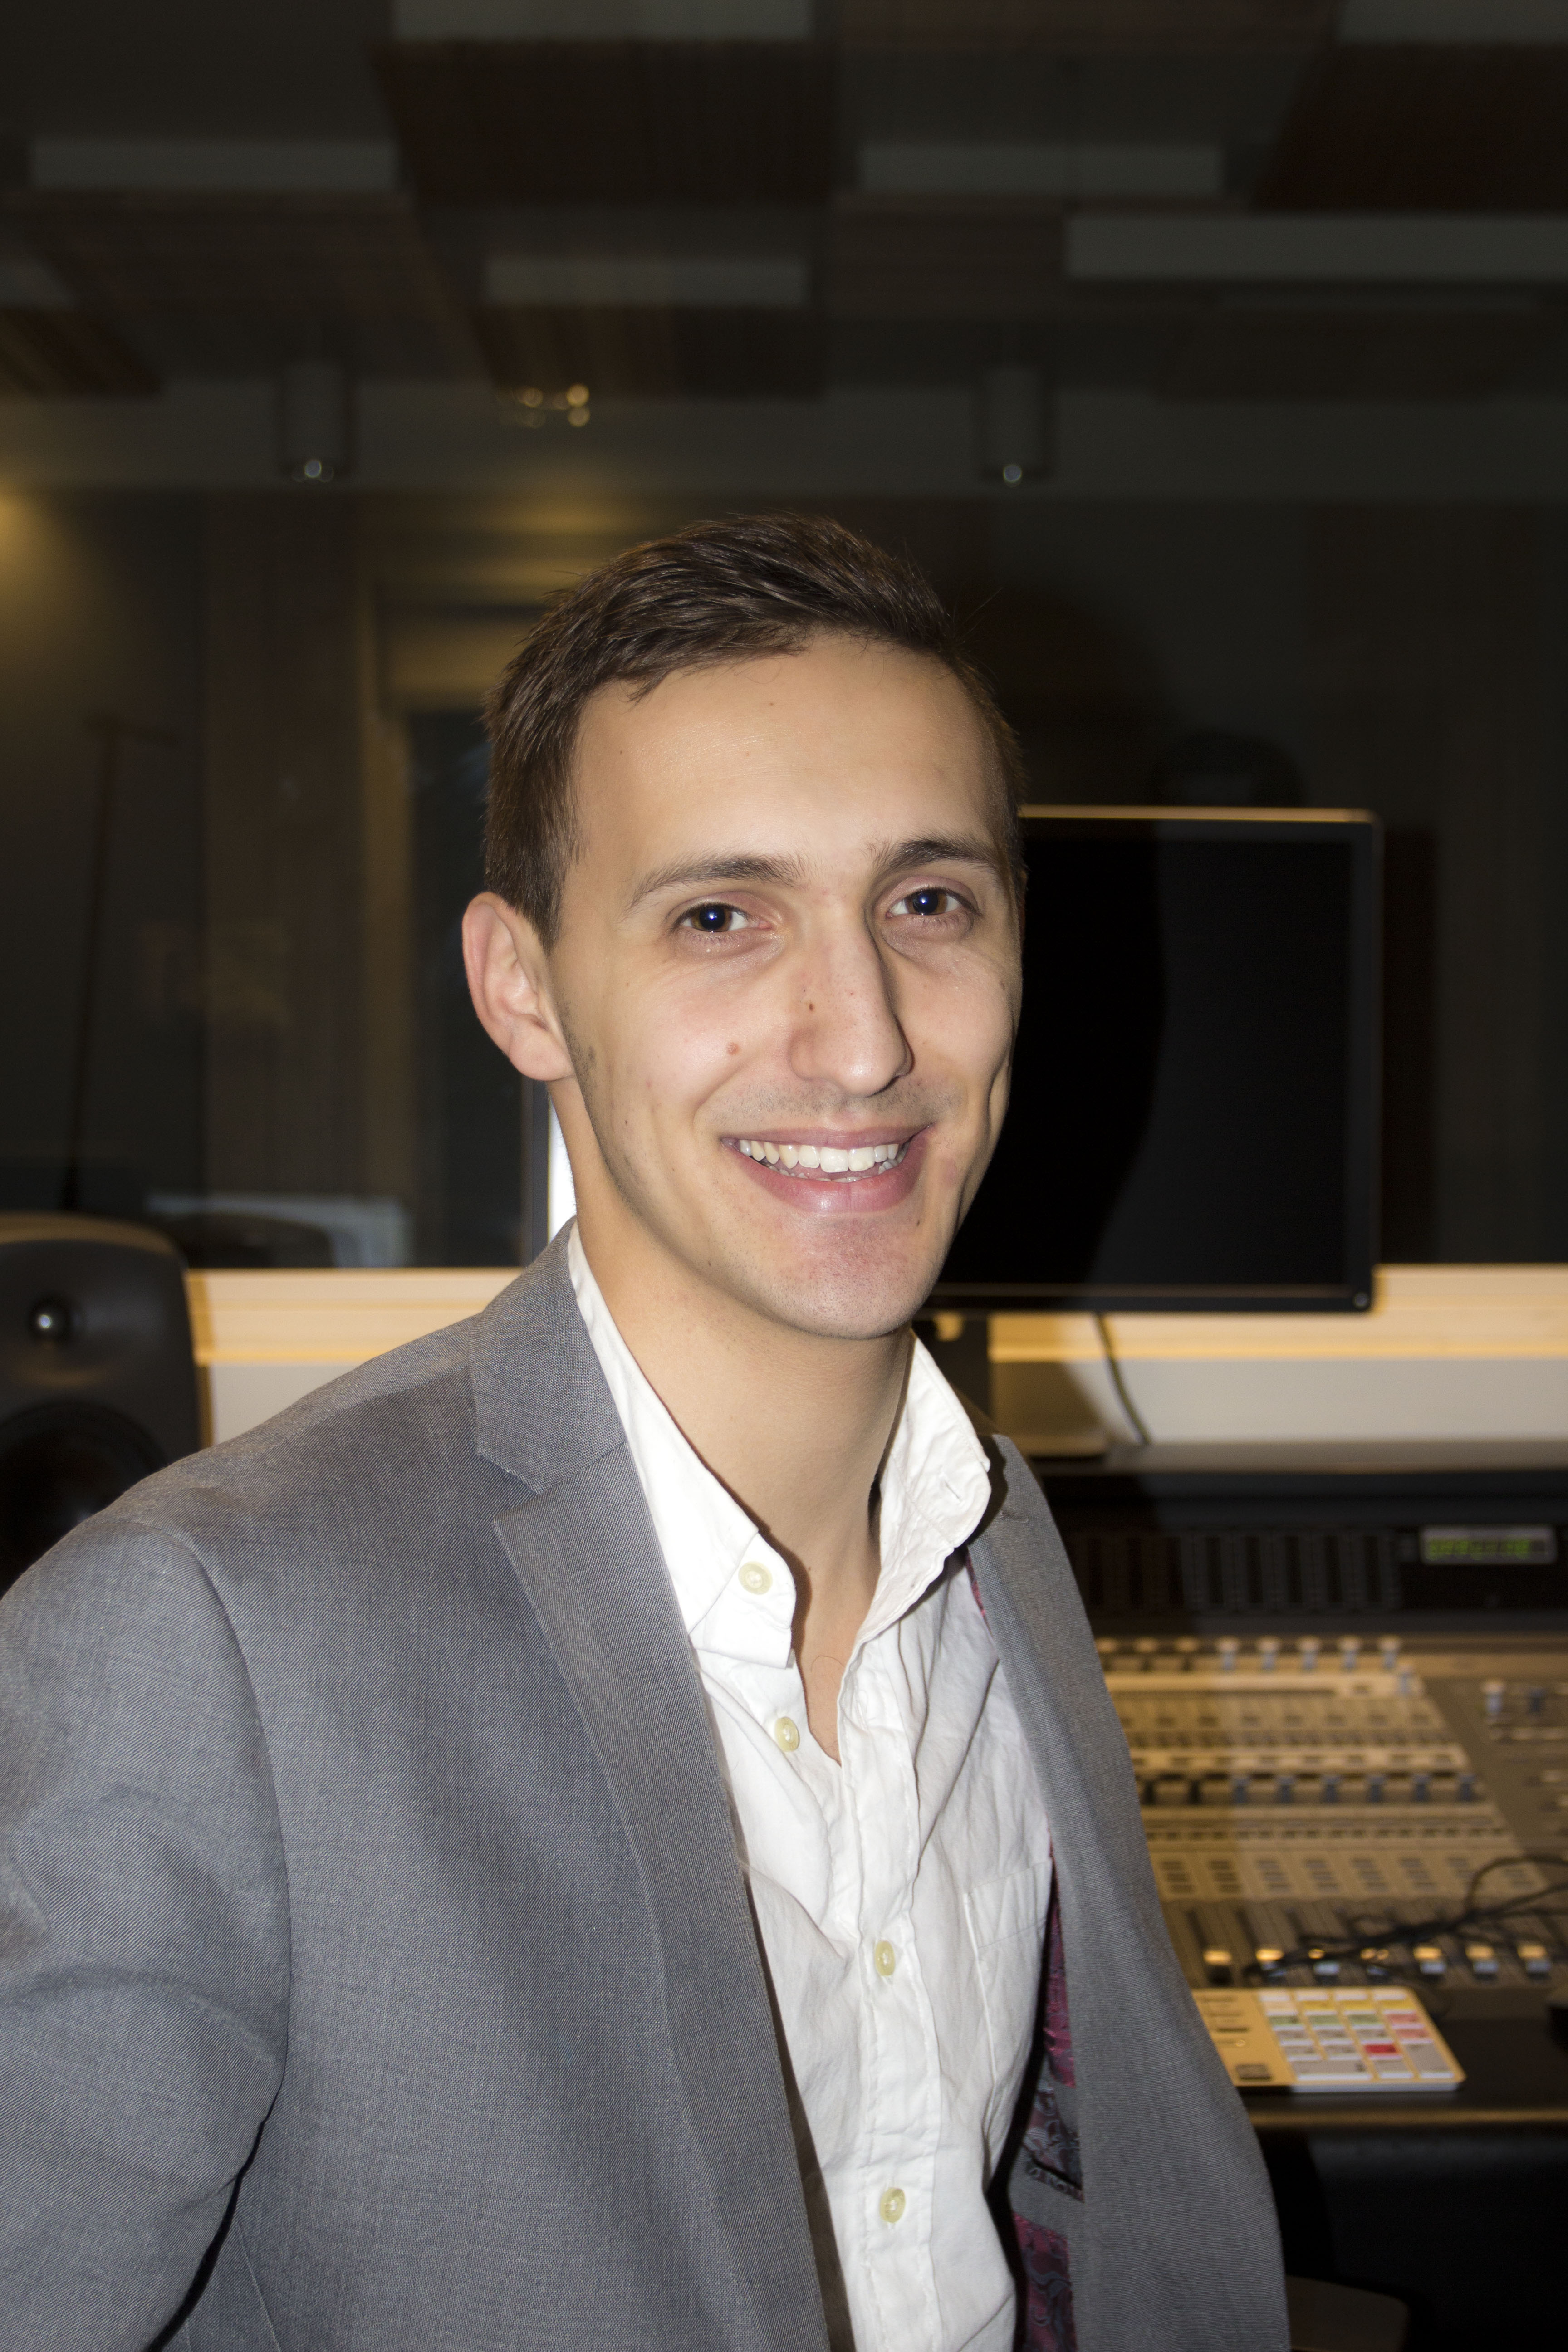
Digital Media Commons Studios Co-op: Lucas LaScala
My name is Luke LaScala but people call me Zander. I am currently a third year Music Industry and Business Administration double major here at Northeastern and I am working at the DMC Studios in Snell! I am a singer songwriter who makes relatable hip-hop music and I have been working in or around studios for the last two years. I love writing songs – making a vision come to life – because I find it very rewarding. I am very excited to host the upcoming audio and video workshops this semester and to teach others how to use the studio and record their songs/videos! We have some great things planned.
3D Printing Studio Co-op: Russell Butenhof
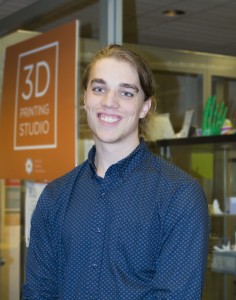
My name is Russell and I am a third year digital art student in the animation program from New Hampshire. I started studying at Northeastern back in the Fall of 2010 as an engineering major. During my third semester in the engineering program I decided to take a year off to explore my passions. During that time I rediscovered art, which was a childhood passion of mine, and decided to leave the engineering college to pursue a career in animation. This is my first co-op. In my free time I enjoy composing songs on my computer, writing lyrics, playing video games, and binge watching television series on Netflix.
Best of luck for a great co-op experience!